Phase Diagram? Morphotropic Phase Boundary? What The Heck Is All That?
Phase Diagram? – Morphotropic Boundary?? What the heck is that?
A good place to start when working with a family of materials is ALWAYS the phase diagram.
What is a phase diagram?
A phase diagram is a visual representation that graphically depicts a material’s crystal structure and behavior over a specified range of compositions and/or temperatures.
In the case of PZT based piezoceramics (a perovskite in the A(B)O3 family), it’s best to first understand the behavior of the basic Pb(Zr,Ti)03 solid solution system. Understanding the phase diagram can help to develop a baseline composition for further enhancement via compositional changes, dopants, and other materials.
Using the phase diagram below as an example (Figure 1) and going old school with pencils and highlighters, we will discuss some of the important features in a very, very, basic sense to help give some insight into phase diagrams and their usefulness as, essentially, a roadmap.
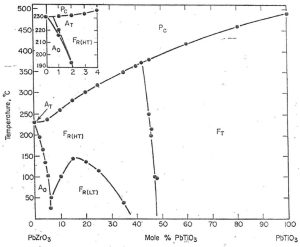
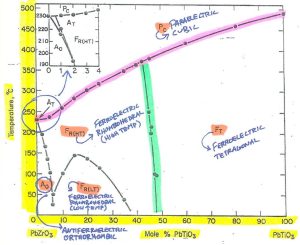
Figure 1 – Basic phase diagram of Pb(Zr,Ti)O3 solid solution systemCredit: Jaffe, 1971, Piezoelectric Ceramics, Academic Press
When looking at the phase diagram initially, it’s important to familiarize yourself with the two axis and their meanings. (Figure 2)
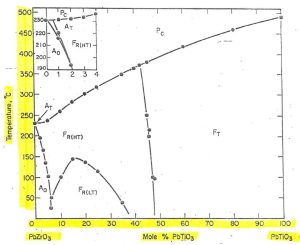
Figure 2 – Note the axis units and valuesCredit: Jaffe, 1971, Piezoelectric Ceramics, Academic Press
In this phase diagram, the Y axis represents temperature from 0 C to 500C, while the X axis represents composition: 100% PbZrO3 (on the left) with progressively increasing mol% PbTiO3 until 100% PbTiO3 (on the right).
Next, we can take a look at what the different abbreviations on the diagram represent (Figure 3).
The capital letters represent the materials behavior (F-Ferroelectric; P-Paraelectric; A-Antiferroelectric) while the subscript letters represent the crystalline phase in each region.
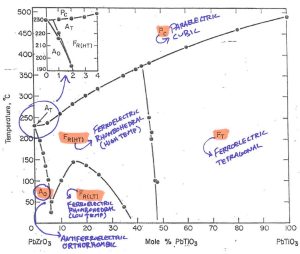
Figure 3 – Notice definitions, phase and performanceCredit: Jaffe, 1971, Piezoelectric Ceramics, Academic Press
Everyone working with any piezo material is likely familiar with the Curie temperature.
From an application engineering standpoint, ½ the Curie temperature is typically the maximum operating temperature.
From a manufacturing standpoint, the Curie temperature is the point at which depolarization occurs.
From a materials engineering standpoint, the Curie temperature is the temperature at which the crystal structure of the material undergoes a phase change to cubic.
It is this change to cubic (from asymmetrical to symmetrical) that results in depolarization. The phase boundary where this occurs is highlighted in red below (Figure 4).
You can see that for any given composition from PbZrO3 through Pb(Zr,Ti)O3 to PbTiO3, there is a corresponding phase transition temperature to cubic (it’s Curie temperature). You can also see that this temperature changes with composition, increasing as mol% PbTiO3 increases.
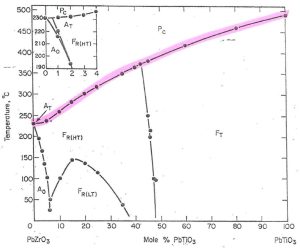
Figure 4 – Highlighted in red is the cubic phase transition point (Curie temperature).Credit: Jaffe, 1971, Piezoelectric Ceramics, Academic Press
So where do we start with compositions for PZT?
It has been experimentally proven that the most optimized properties of basic PZT ceramics (coupling and dielectric constant for example) occur in compositions at or near the morphotropic phase boundary (MPB). This is also a term many have heard.
A morphotropic phase boundary is a phase transition point driven almost exclusively by varying composition, while remaining essentially independent of temperature (hence why this boundary is near vertical). Along this line, the material has both rhombohedral and tetragonal phases, ideally even amounts of each.
The MPB is highlighted in green.
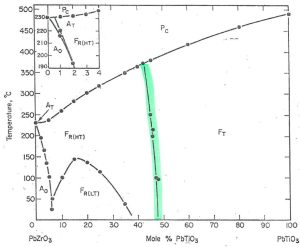
Figure 5 – Highlighted in green is the morphotropic phase boundary (MPB).Credit: Jaffe, 1971, Piezoelectric Ceramics, Academic Press
So for maximum properties and stability – a composition along this line would be a great starting point for a PZT ceramic.
Referring back to the X axis of the phase diagram, we can find ourselves a good starting point. The morphotropic phase boundary aligns nicely with ~47 mol% PbTiO3.
The PZT composition (being a perovskite in the A(B)O3 family – Pb(Zr,Ti)O3), can now be represented by the formula Pb(Zr1-xTix)O3. This results in the very well known, very well documented and researched Pb(Zr.53Ti0.47)O3 formulation, which serves as a great springboard for modified compositions, dopant additives, etc.
This is just a very basic review of one phase diagram to show (as an example) how basic PZT compositions can be determined.
Since the development of this phase diagram by Jaffe et al, others have been developed with significantly more information indicating even potential monoclinic phases near the MPB.
Phase Diagrams – A Rainbow of Information!